Chicago PMI Corrupted By Global Supply Chain Collapse, National Economic Activity Collapses
by Tyler Durden
ZeroHedge.com
Tue, 03/31/2020
Following yesterday’s record-smashing collapse in Dallas Fed’s manufacturing survey, expectations were for Chicago’s PMI to tumble after it’s surprising rebound in February (bucking the trend of all the other regional surveys).
But, in true WTF insanity, Chicago PMI printed 47.8 (smashing expectations of 40)…
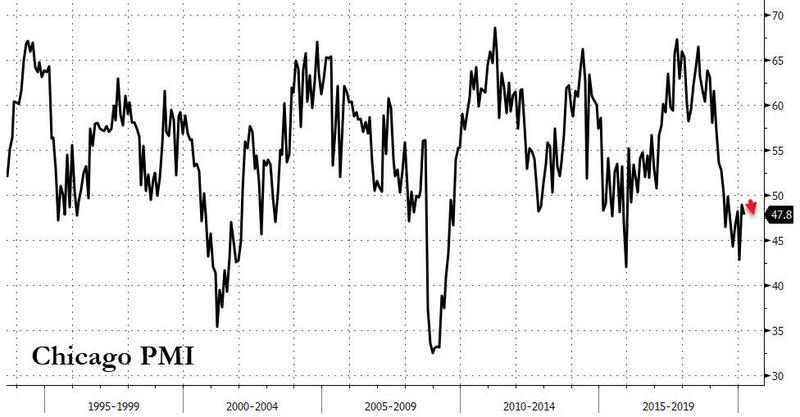
Source: Bloomberg
The driver of this seemingly insane print is the same as has caused problems with aggregate PMIs – supplier delivery times rising at a faster pace – typically seen as a sign of expansion. However, in this case it is caused by collapsing global supply chains, and along with prices paid rising rapidly means a stagflationary collapse in global trade… not exactly the positive signal the index is trying to send.
Supplier deliveries rose at a faster pace, signaling expansion
Prices paid rose at a faster pace, signaling expansion
Everything else contracted…
New orders fell at a faster pace, signaling contraction
Employment fell at a slower pace, signaling contraction
Inventories fell at a faster pace, signaling contraction
Production fell and the direction reversed, signaling contraction
Order backlogs fell at a slower pace, signaling contraction
And thus, Chicago fed bucks the trend in the regional surveys once again…
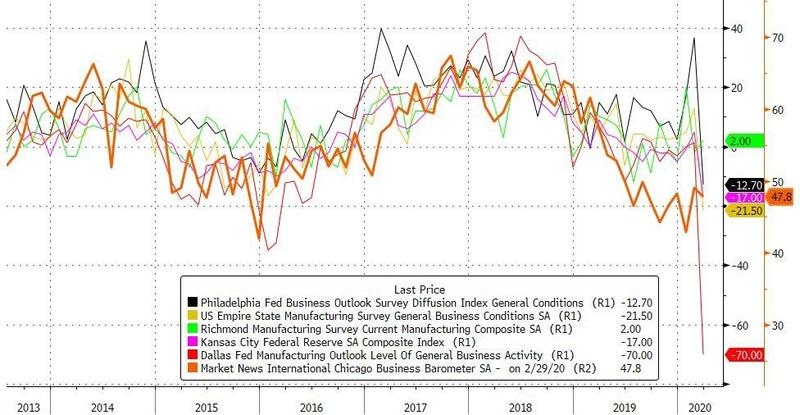
Source: Bloomberg
Finally, we note a new measure from The New York Fed which aims to gather higher-frequency national data (weekly) to indicate economic progress.
Economists are well-practiced at assessing real activity based on familiar aggregate time series, like the unemployment rate, industrial production, or GDP growth. However, these series represent monthly or quarterly averages of economic conditions, and are only available at a considerable lag, after the month or quarter ends. When the economy hits sudden headwinds, like the COVID-19 pandemic, conditions can evolve rapidly. How can we monitor the high-frequency evolution of the economy in “real time”?
To address this challenge, we compute a Weekly Economic Index (WEI) to measure real economic activity at a weekly frequency. Few of the government agency data releases macroeconomists often work with are available at weekly or higher frequency. While financial data, like stock market prices and interest rates, are available at high frequency, we are particularly interested in real activity, not financial conditions. For our purpose, most weekly series come from private sources like industry groups, which collect data for the use of their members, or from commercial polling companies.
They might want to disband this series stat!
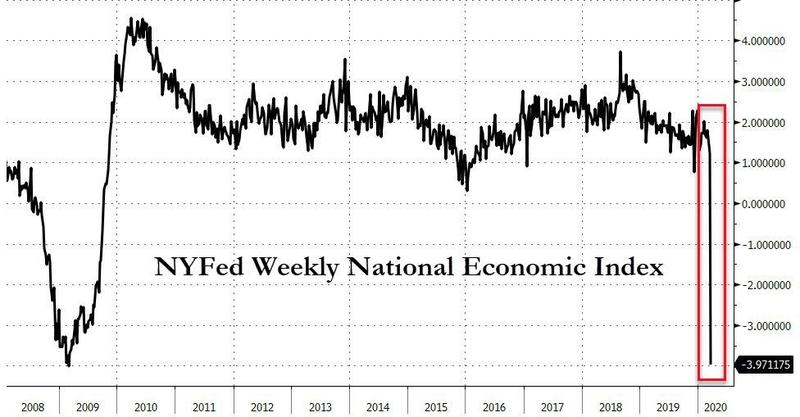
Source: Bloomberg
That is not a pretty picture.


