“You’re Forecasting A Revolution” – Household Leverage Ratios By Wealth Distribution
by Global Macro Monitor,
ZeroHedge.com
Thu, 09/12/2019
We are just starting to play with the wealth distribution data and will have much more coming your way. What we have seen so far is shocking.
The distribution of wealth has deteriorated significantly over the past 20 years and is now so skewed toward the top that average U.S. household wealth is close to $1 million, though the median household wealth is only around $70k.
In fact, the aggregate level of wealth of the bottom 50 percent peaked in Q1 2000, the height of the dot.com bubble, and is down almost 10 percent in nominal terms. Whereas, the aggregate wealth level of the top 1 percent is up almost 120 percent over the same period.
If I brought a number or a forecast like that to my manager when I was a very young economist working on the World Bank’s capital flows model back in the day, he would say,
“You are forecasting revolution.”
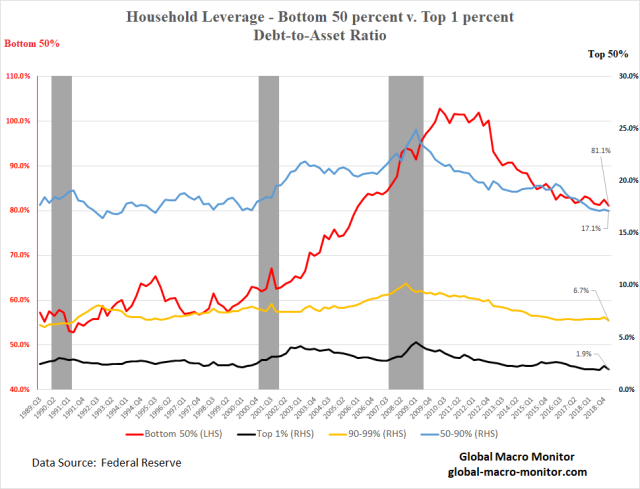
Note the relative leverage ratio of the bottom 50 percent. For several quarters after the GFC the bottom 50 percent, not all households but in aggregate, were technically insolvent, where debt levels were greater than the value of assets ( > 100 percent on the chart).
These data put the current political climate and debate around debt forgiveness in context. They also reflect the two-speed U.S. economy.
Stay tuned for some more shocking data.

Long pitchforks.


